All About Gamma
The curvature that runs the tape — from the calculus you forgot to the dealer flows that turn an ordinary headline into a 3-sigma flush. Every figure on this page is interactive. Drive them.
Two days that explain everything
On Friday, June 5, 2026, a hot jobs report hit a market that had been grinding higher for weeks. The Nasdaq fell 4.8% — a 3-sigma day. The following Tuesday, a cluster of headlines hit the same market. The S&P sliced through three months of levels in two hours, pierced its daily 2-sigma band, then recovered 145 points into the close as if nothing happened.
Here is the uncomfortable part: the headlines did not decide how far those moves went. On both days, the selling accelerated precisely through the price zones where option dealers were most exposed, and stopped precisely where that exposure ended. The news chose the day. The options market chose the distance.
The force behind that is called gamma. It is not a conspiracy and it is not sentiment — it is a mechanical consequence of how dealers must hedge the options the rest of the market buys and sells. When the dealer book is positioned one way, the market absorbs shocks and grinds. Positioned the other way, the same machinery amplifies every move — selling begets selling, and a price drop becomes the cause of the next price drop.
By the end of this page you will understand that machine from first principles: what gamma actually is (a second derivative — we will rebuild what that means from scratch), why dealers are forced to trade it, how it creates melt-ups, pins, and flushes, how to read a gamma map, and why on certain days the right move is to sell into the selling instead of trying to catch the knife.
Why not just ignore the plumbing and trade the chart?
The calculus you forgot, in four ideas
Twenty years removed from a calc classroom, you need exactly four ideas back. Not the homework — the pictures.
1. A function is a curve. A function is just a rule that turns one number into another: feed in time on a road trip, get back total distance driven. Plot it and you get a curve. Everything in calculus is about the shape of that curve.
2. The derivative is the slope — right now. The derivative asks: if the input nudges up a tiny bit, how fast does the output change? On the road trip, the derivative of distance is speed — literally the number on your speedometer at this instant. On a graph, it is the steepness of the curve at one point: the slope of the tangent line that just kisses the curve there.
3. The second derivative is how the slope itself is changing. Take the derivative of the derivative. On the road trip, that is acceleration — your foot on the pedal. The speedometer tells you how fast distance is changing; the accelerator tells you how fast the speedometer is changing. On a graph, the second derivative is curvature: zero means the curve is a straight line, large means it bends hard.
4. A tangent line is a prediction — and curvature is how wrong it goes. If you know your speed right now, you can predict where you will be in a minute: distance ≈ speed × time. That prediction is the tangent line. It is exact for a car at constant speed and increasingly wrong the harder you accelerate. Hold that thought — it is the entire options market in one sentence.
Drag through the drive. Where the distance curve bends upward, acceleration is positive and the tangent under-predicts; where it flattens through traffic, acceleration is negative. The bottom panel is the bend of the top panel — that relationship is gamma's relationship to an option's price, and you have now seen the whole trick.
That is genuinely all of it: f is a curve, f′ is its slope, f″ is its bend. In options, those three will be called value, delta, and gamma — same pictures, different axis labels.
Will I ever need to compute a derivative myself?
What would the world look like if option values were straight lines instead of curves?
Options in five minutes
A call option is a coupon: it gives its owner the right — not the obligation — to buy a stock at a fixed price (the strike) any time before a deadline (the expiration). A put option is the mirror image — the right to sell at the strike. The price you pay for the coupon is the premium.
Whether the coupon is worth anything at the deadline depends on where the stock lands. A call struck at $100 is worthless if the stock finishes at $95 — why use a coupon to pay $100 for something selling at $95? — but worth $20 if the stock finishes at $120. Plot that payoff and you get the famous hockey stick: flat at zero below the strike, rising one-for-one above it. Where the stock sits relative to the strike is called moneyness — out of the money, at the money, in the money.
Slide the ending price. Notice the asymmetry: the most you can ever lose is the $4 premium, while the upside is uncapped. That asymmetry is why the value curve will bend in the next section — and the bend is everything.
The other side of the trade
Every option someone buys, someone else sold. Most of the time the seller is a market maker — a dealer whose business is quoting both sides and collecting the spread, not betting on direction. A dealer who sells you a call does not want to be short the stock's upside; a dealer who buys your put does not want to be long the downside. So dealers neutralize: they hold exactly enough stock against each option position that small moves in the stock cancel out. That state is called delta-neutral, and the number of shares it takes is dictated by delta.
The curve — where gamma lives
The hockey stick is the option's value at the deadline. But before expiration, with time on the clock and the future uncertain, the option's value is a smooth curve sitting above the hockey stick. Why smooth? Because a stock at $98 with 60 days left still has a real chance of finishing above $100 — that chance is worth money. The kink gets rounded off by probability.
And here is the chain that runs the rest of this page. The option's value V(S) is a function of the stock price — a curve, like distance was a function of time. So it has a slope, and the slope has a bend:
Delta has a second identity, and it is the one that moves markets: it is the dealer's hedge ratio. The tangent line at the current stock price IS the dealer's hedge — the best linear approximation to a curved liability. A dealer short a 0.50-delta call buys 50 shares per contract and is locally flat. Locally. The amber wedge in the figure below is everything the linear hedge fails to capture, and that wedge is gamma's territory.
Drag the spot price: the wedge is fattest near the strike, where the curve bends hardest, and vanishes deep in or out of the money where the curve runs straight. Now drag days down toward 1 and watch the curve melt onto the hockey stick while the remaining bend concentrates at the strike. Strike $100, volatility 25%.
Deeper math — why the curve is convex
The value is a probability-weighted average over outcomes: V = e⁻ʳᵀ ∙ E[max(Sᵀ − K, 0)]. Averaging a kinked payoff over a spread of outcomes always smooths the kink, and because the payoff's downside is floored at zero while the upside is open, the smoothed function must bend upward — convexity is the geometry of limited loss with unlimited gain. Curvature is literally the optionality.
What if the dealer re-hedges constantly instead of waiting?
Delta and gamma, formally
Stack the option's value curve with its two derivatives, exactly like the road trip. Value V(S) is the curve. Delta Δ(S) — its slope — turns out to be an S-shaped ramp running from 0 to 1: deep out of the money the option ignores the stock (slope 0), deep in the money it moves dollar-for-dollar (slope 1). In between, delta behaves like the market's live estimate of the odds the option finishes in the money. And gamma Γ(S) — the slope of delta — is a bell curve that peaks at the strike, because the S-ramp is steepest in its middle.
Press collapse. As the clock runs out, delta sharpens from a gentle ramp into a cliff — at expiry it is a step: 0 below the strike, 1 above. Gamma is the slope of that ramp, so it concentrates into a spike. At-the-money gamma scales like 1/√T: with 1 day left it is roughly 8× its 60-day value. This is why 0DTE options dominate intraday hedging flow — they are traded inside the singularity.
If gamma peaks at the strike, which strikes matter most on any given day?
Calls and puts at the same strike — different gamma?
Deeper math — the actual formulas
Under Black-Scholes with volatility σ and time T: Δ = N(d₁) where d₁ = [ln(S/K) + (r + σ²/2)T] / (σ√T), and Γ = φ(d₁) / (Sσ√T) — φ is the bell-curve density, N its cumulative area. Two things to notice without solving anything: Γ > 0 always (long options are always convex), and the √T in the denominator is the expiry singularity — as T → 0 at the money, gamma → ∞. The figures on this page run exactly these formulas live.
The money formula — ½Γ·(ΔS)²
Here is where geometry becomes profit and loss. If the stock moves by a small amount ΔS, how much does the option move? Calculus answers with the Taylor expansion — predict with the line, then correct for the bend:
Now remember what the dealer did: he hedged the first term away. Delta-neutral means the Δ·ΔS piece cancels against his stock position by construction. What is left of his daily P&L is the second term — and it is quadratic in the move. That one word does an enormous amount of work:
- Long gamma (you own the options): ½Γ(ΔS)² is positive whichever way the stock goes. Every move pays you. Your P&L curve is a smile.
- Short gamma (you sold the options — the dealer during a call-buying frenzy): every move costs you. Your P&L curve is a frown. And because the loss is quadratic, a 2-sigma day hurts 4× and a 3-sigma day hurts 9×.
Stylized book: 1,000 at-the-money contracts, Γ ≈ 4,000 shares per $1 of movement, 1σ day = $5, delta already hedged. Toggle the book and watch the forced-flow direction flip: the short-gamma desk buys into rallies and sells into declines — it chases. The long-gamma desk does the opposite — it fades.
Look hard at the middle card. The P&L is quadratic, but the re-hedging flow — the shares the dealer must trade to get flat again — is Γ·ΔS: it grows with every leg of the move, and for a short-gamma book it trades in the same direction as the move. That pairing — quadratic pain, escalating same-direction flow — is the entire urgency engine behind a flush. Nobody on that desk is panicking; they are doing arithmetic.
Why does a short-gamma desk hedge at all? Why not ride it out?
If long gamma gets paid on every move, why doesn't everyone just buy options?
From one desk to the whole market
Now zoom out. Thousands of strikes, dozens of expirations, every dealer in the complex — sum the gamma of all of it, signed by who is long and who is short, and you get the street's aggregate book. Analysts plot it by strike as gamma exposure (GEX): tall positive bars where dealers are long lots of gamma, deep negative bars where they are short it. Three features matter on every such map:
- A call wall — the biggest positive-gamma strike overhead. Dealers sell harder into every approach; rallies stall there.
- A put shelf — the biggest negative-gamma strike below. Approaching it makes dealer books shorter gamma, hedging selling intensifies into it.
- The gamma flip — the price where the aggregate book changes sign. Above it the market is in stabilizing hands; below it, the same machinery turns into an amplifier.
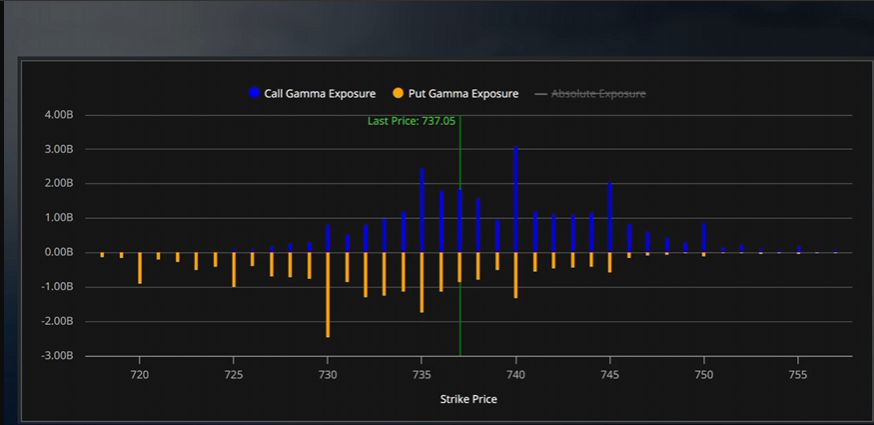
This is the actual SPY gamma profile heading into the June 10 CPI print — the same chart institutional desks watched overnight. Blue bars: call gamma by strike. Orange: put gamma. Spot (green line, 737.05) is sandwiched between the 740 call wall (~$3B) and the 730 put shelf (~-$2.4B): a pin pocket. While price holds the pocket, dealer hedging dampens everything. Lose 730 on a hot print and the book flips — the trapdoor.
What the sign of the book does to a trading day
This is the heart of the whole subject. The same random news, fed through opposite dealer books, produces unrecognizably different days. When the street is long gamma, hedging flow opposes every move — rips get sold, dips get bought, the day compresses into a grind and often pins to the biggest strike. When the street is short gamma, hedging flow chases every move — and a sell-off manufactures its own follow-through.
The same 390 one-minute shocks feed both paths; only the hedge-feedback sign differs. Set k to 0 and the streets trade identically — news alone sets the range. At 0.45, watch the red path slice through sigma bands the teal path never threatens. The dashed bands mark what the day "should" contain on news alone — in negative gamma they are not containment, they are milestones.
What actually decides whether the street is long or short gamma?
Why do sell-offs in negative gamma look like stairs — flush, pause, flush?
Anatomy of a gamma squeeze — and why the ending is violent
A gamma squeeze is the short-gamma amplifier running in reverse gear — upward. The recipe: a crowd starts buying short-dated out-of-the-money calls on one name. Dealers sell the calls and buy stock to hedge. The buying lifts price toward the strikes; deltas rise (that is gamma); dealers must buy more. New buyers see the move and chase with more calls. The loop feeds itself — and implied volatility inflates with it, making every new coupon more expensive.
Which is exactly why every squeeze carries its own expiration date. The loop needs a constant influx of new call buying, and rising premiums eventually choke it: the volume of fresh calls dries up, dealer inventory peaks, and the machine stalls. Then the reversal — and notice the asymmetry. On the way up, dealer buying was throttled by the pace of new call volume. On the way down, the trigger is winners closing calls all at once: every closed call instantly strands its hedge, so dealers are not easing out of stock, they are dumping a position that no longer has a reason to exist — into a tape where every other dealer is doing the same.
Watch the blue lane: inventory builds for 150 bars and liquidates in 60 — with stair-step pauses where hedge tranches finish clearing. The unwind is faster than the build because closing is synchronized; building was not. And the amber lane's collapse is the IV crush — the reason even well-timed put buyers often lose money on the break: the volatility they paid for deflates faster than the price falls.
Could a dealer just refuse to play — not hedge, and eat the risk?
How do you tell a squeeze is ending while it is still going up?
The June tape, annotated — four sessions on the real chart
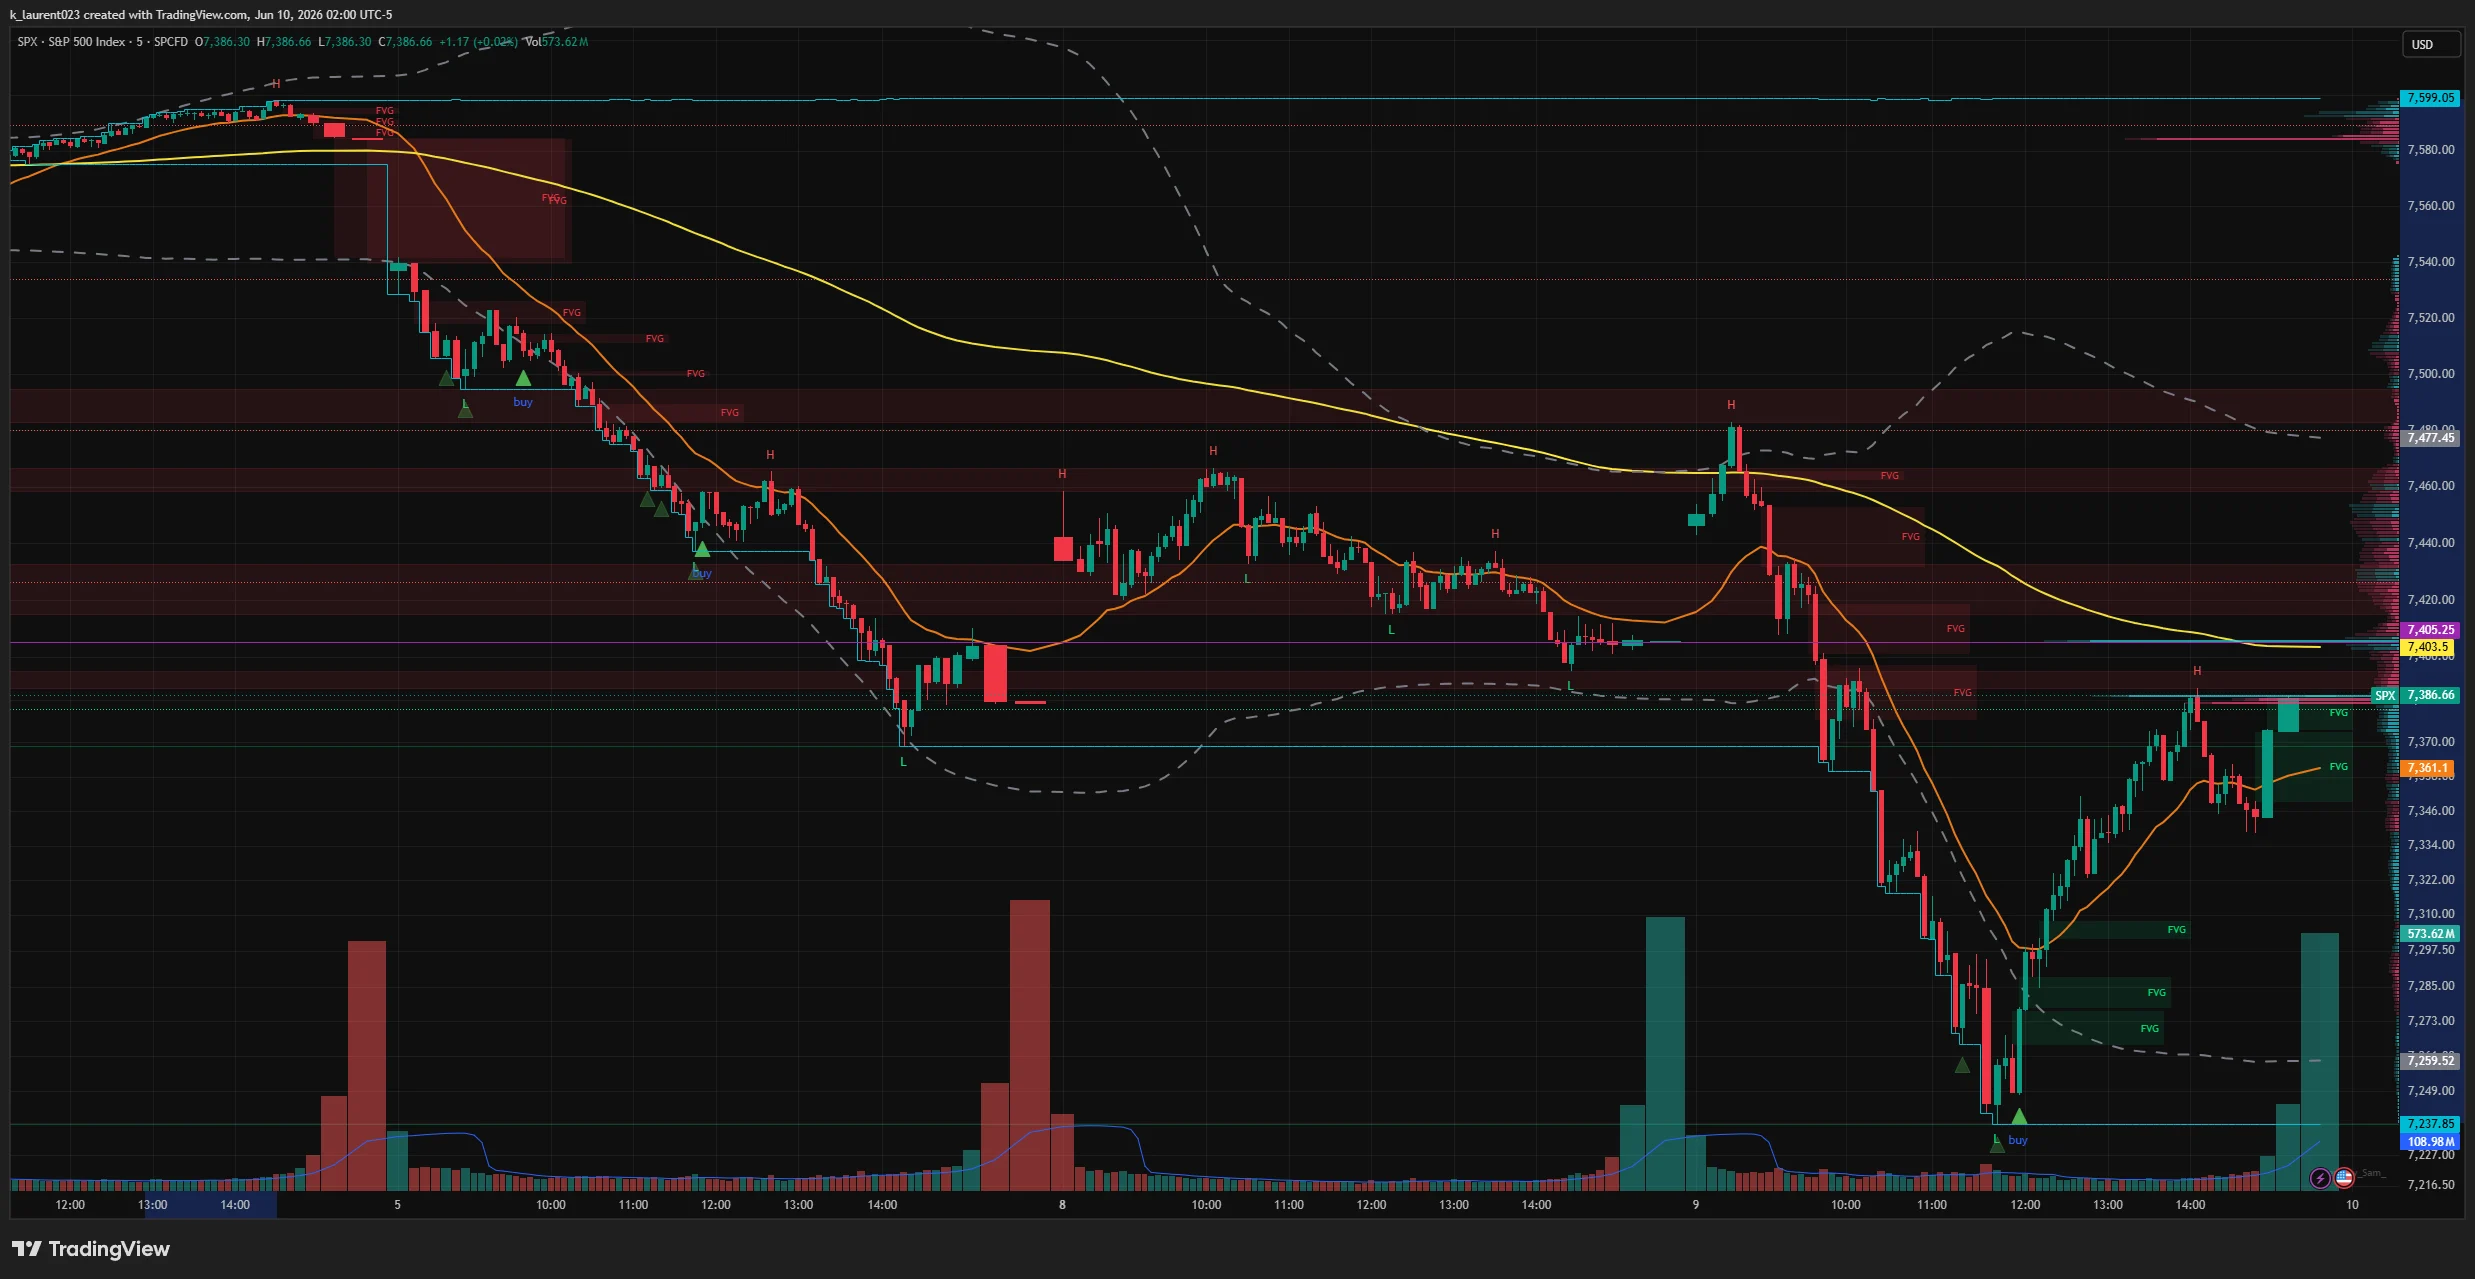
Theory over. Below is the actual S&P 500 five-minute chart from June 4 through the early hours of June 10, 2026 — the exact tape this page opened with. Step through the tour: every annotation is one of the mechanics you just learned, drawn where it happened.
What the flow data showed underneath
Friday 06/05 — the squeeze ends. May payrolls printed +172K against +80K expected, yields jumped, and the Nasdaq fell 4.8%. The index closed at 7,384 — below the 7,480 level where the dealer book flips — and the market-wide measure of dealer hedging positions printed its deepest reading since December. Our daily report that evening put it plainly:
"The mechanical floor did not just disappear; it reversed polarity. That is why a hot jobs print produced a 3-sigma move instead of a 1-sigma one: there was no dealer bid underneath the most crowded trade when the catalyst hit."Anti Narrative daily report, 06/05/26
Monday 06/08 — the bait. A bounce on fading volume, dying exactly at the underside of the broken shelf near 7,477. Corrective structure, no flow confirmation — and the options tape that day was busy buying downside protection into the strength, not chasing the rally.
Tuesday 06/09 — distance chosen by the options market. Iran headlines and an Apple regulatory hit chose the day. The options market chose the distance: the slide accelerated precisely through the strikes where dealer gamma was shortest — roughly -$1.55B at 7,365 with more than -$2B stacked between 7,305 and 7,375 — pierced the daily 2-sigma band by ~48 points, and stopped almost to the dollar where the long-gamma shelf began. Then the reclaim: 145 points into the close.
"Price recovered 145 handles into the close. Flow did not recover at all... the people who could have bought the dip in size chose, for the third session running, not to."Anti Narrative daily report, 06/09/26
That recovery was dealers buying back their own same-day short-call hedges into the bell — arithmetic, not conviction. Hollow reclaims are a signature of negative-gamma tape: price travels, ownership does not change hands.
Hold on — if the bands got pierced, what use are sigma bands at all?
The invisible flows — vanna and charm
One last layer, and it is the one that moves markets when nothing is happening. The option price is not a function of the stock price alone — it is V(S, σ, t): stock price, implied volatility, time. Multivariable calculus says every pair of variables gets its own mixed second derivative, and two of them generate real, scheduled, tradeable flows:
Think of the delta ramp from Figure 4 as a curve the dealer is standing on. Vanna and charm move the curve under his feet. Volatility falls after an event passes — every out-of-the-money delta shrinks, and the dealer is suddenly over-hedged, holding shares he must shed. A day ticks by — same thing, gradually, all day, every day. Those re-hedges are share flow with zero price catalyst, which is why indexes can drift persistently after a feared event passes (the post-event vol crush is sold back into the market as dealer supply or demand) and why expiration weeks develop a gravitational pull toward big strikes.
vanna piece: -0.068 · charm piece: 0.000 · dealer short 1,000 calls at K=$100 (100,000 shares per 1.00Δ)
The defaults above are tomorrow morning's setup: a -6 point volatility crush is roughly what a benign CPI print does to front-month implied vol. Slide days forward and watch charm drag every out-of-the-money delta toward zero into an expiration — that is the pinning engine. As one options-desk educator puts it: when a market maker is large enough to matter, all of their flows, in every situation, point back toward their largest expiring strike.
So what is the difference between a "vanna rally" and a real one?
Why do big expirations act like magnets?
The playbook — what to actually do with all this
First, diagnose the regime before trusting any signal. The same candlestick pattern, the same support level, the same oversold reading mean opposite things on opposite sides of the gamma flip. Above the flip, dips into big strikes are mechanically absorbed — buying them is swimming with the plumbing. Below the flip, "support" is where the next tranche of forced selling lives.
Second, respect the knife rule. In negative gamma, the marginal seller is mechanical and price-insensitive. He is not selling because he thinks the market is going lower; he is selling BECAUSE it went lower — his required size is Γ·ΔS, growing with the move, and the book gets shorter gamma as price approaches each put shelf. Flow like that does not exhaust because price got cheap. It exhausts when the book is re-neutralized: at a long-gamma shelf, at the close, or at an expiration. Until one of those arrives, sigma bands are waypoints, not magnets — and catching the knife means providing liquidity to a seller who is not done.
Third, know your tells. The regime is readable every single day:
- Where is spot versus the flip level? The single most important line on the map. Above: fade extremes. Below: respect momentum.
- Where are the walls? The big call wall caps rallies; the big put shelf is the trapdoor. Between two big strikes with positive gamma = pin pocket.
- Is dealer positioning stretched? Deep, deepening short-dealer-delta readings (like the record prints of June 5-9) mean the amplifier is wired and waiting for a catalyst.
- Do bounces carry flow? Price up + options tape still buying puts + no cash accumulation = hollow reclaim = the bait.
- What expires this week? Gamma concentrates at near-dated strikes. Big expirations both pin the tape before and un-anchor it after.
Fourth, remember the asymmetry of the unwind. Hedge inventory builds at the pace of new option buying but liquidates at the pace of synchronized closing. Up the stairs, down the elevator is not a proverb — it is ½Γ(ΔS)² with the sign flipped and everyone's risk limits binding at once.
And if you only carry one sentence out of this page, carry this one: the news chooses the day; the options market chooses the distance. You now know how to read the distance in advance.
Glossary
Every dashed term from the page, in one place. Click any card.
Sources and further reading
- Anti Narrative daily reports: 06/05 — the rate-shock flush · 06/08 — the bounce · 06/09 — the hollow reclaim
- VolSignals educational webinar series — the Greeks, pinning at expiration (charm + gamma), and reading market volatility through dealer positioning.
- Trader commentary series on gamma squeeze life cycles and dealer de-hedging dynamics (MAV, June 2026) and institutional flow context (Mike Silva / FOM, June 2026).
- Flow and positioning data referenced throughout: Tradytics darkpool and options feeds; dealer exposure aggregates as published in the daily reports above.
- The mathematics is standard Black-Scholes-Merton; every figure on this page computes the real formulas live in your browser.